Back Home Next
Plotting diagrams
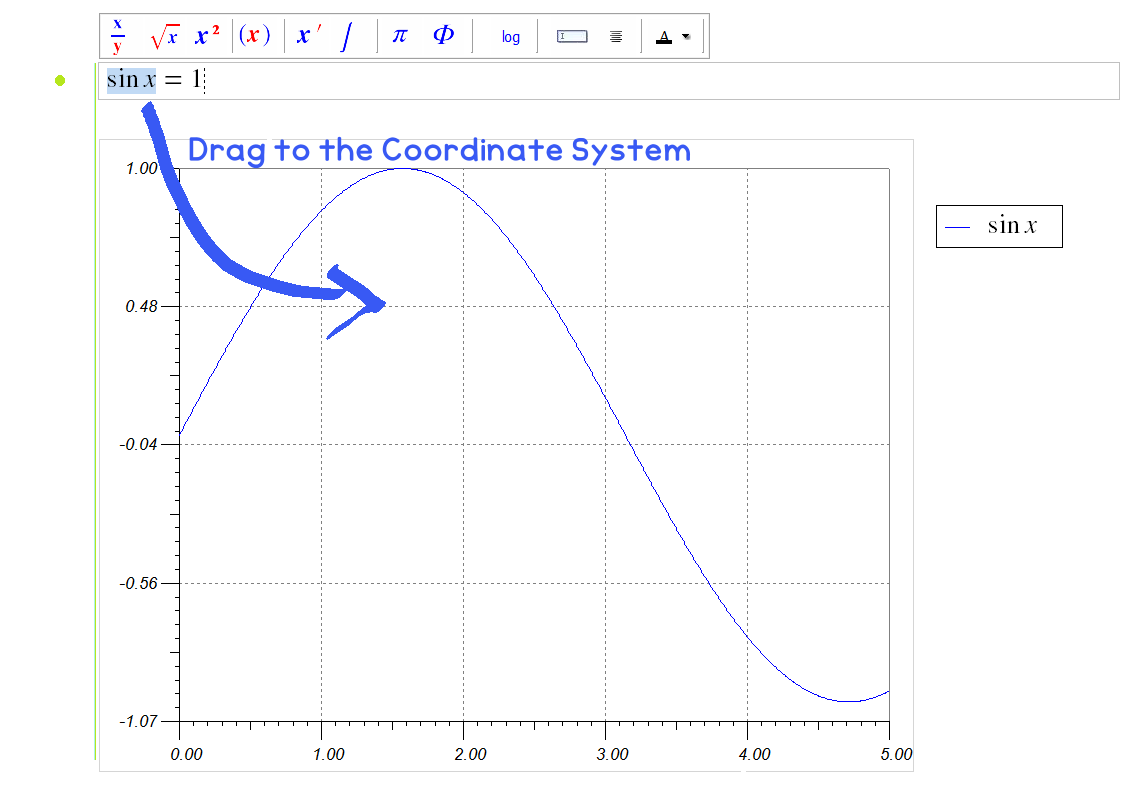
If you want to plot a function, first place an empty diagram  (coordinate system) on the workspace. When it appears you only have to
enter your formula into the legend.
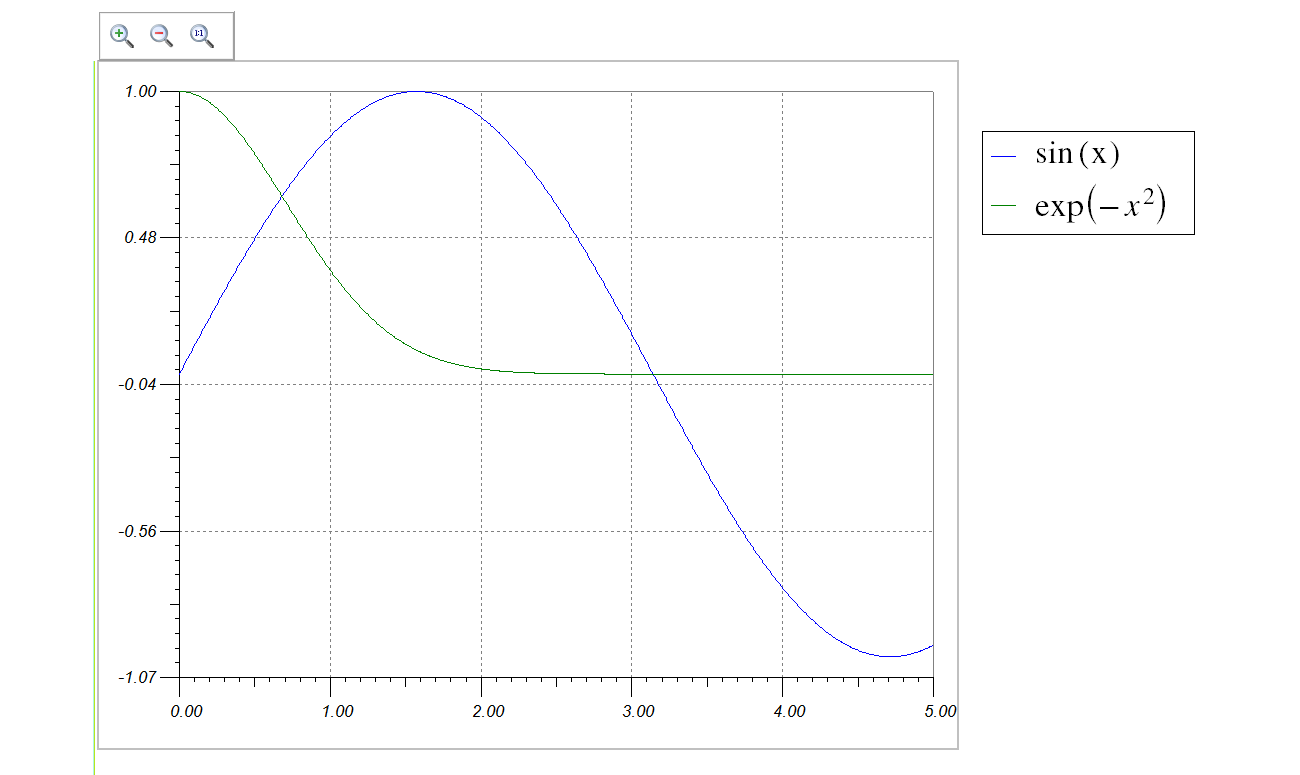
Here are some examples:
(coordinate system) on the workspace. When it appears you only have to
enter your formula into the legend.
Here are some examples:
- 3x+6
- sin(x)
- sin(x+t)
- exp(-x^2)
Note that creating your formula you have to use the 'x' variable as
independent variable and in addition you can use the 't' variable
to create animated time-dependent plots.
Here are some small tricks you can apply!
- You can create and delete any curves using the floating tool bar
appearing above the legend, when select any of the formulas.
- To shift plotting area by clicking and dragging above the
diagrams.
- Click on a curve to see its value in a point, in addition
crosshairs will appear which you can move on the curve to read the
value of further points.
- Double clicking on the axis or the curves, this will invoke
their property dialogs.
- If you have a formula and you want to plot it, the best way to
select and drop it on the diagram.
With Gebra you have the possibilities to import curves from any CSV
files and fit functions to them. Selecting the diagram you will find
icons for importing ( or exporting) files. Selecting the curve you can
also find and icon on the right vertical toolbar for fitting. See
tutorial fitting curves on imported
points for further information.
Gebra offers you to plot formulas containing two independent variables
'x' and 'y'. The rule is similar as above, place an empty 3D diagram  on
the workspace and edit the legend.
Some examples
on
the workspace and edit the legend.
Some examples
- 3x+y
- sin(x+y)
- sin(x)*cos(y)
- exp(-(x^2+y^2))
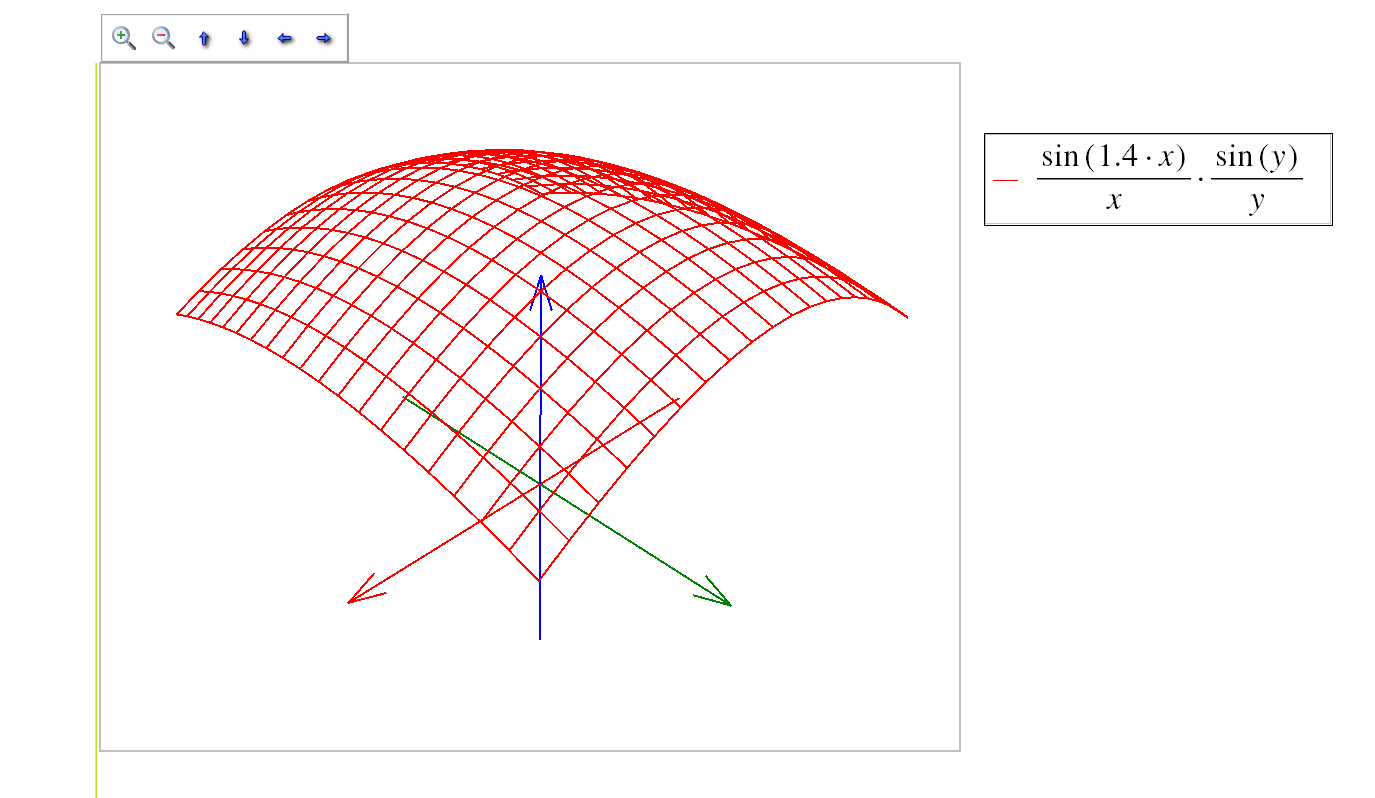
You can rotate the 3D plot by clicking and dragging with the mouse
and double-clicking on the surfaces you can invoke dialogs where you
can change the corresponding properties (resolution, region etc.).
Back
Home Next